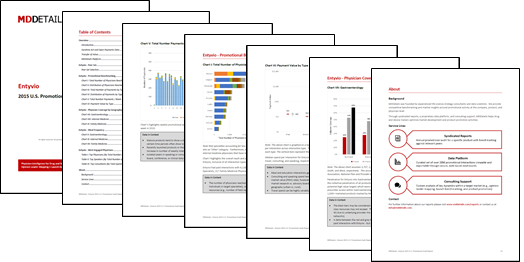
Our annual audits provide promotional benchmarking based on company-reported transparency data. Each report contains a set of market-level and product-specific insights, as highlighted below. Reports are available for more than 500 marketed brands.
Search by company (e.g., “Merck”), product (e.g., “Januvia”), indication (e.g., “Diabetes”), or specialty area (e.g., “Endocrinology”)
Report Content Highlights
The following charts and tables are included in each product report
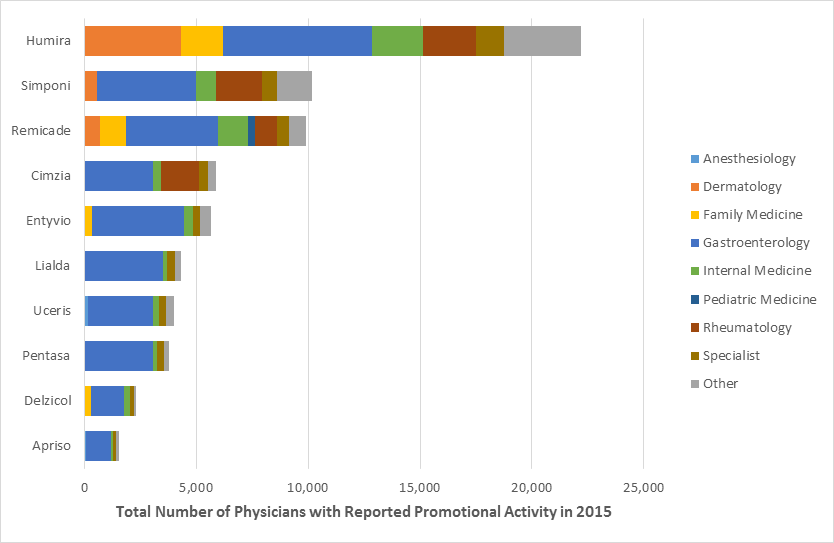
Annual Promotional Reach
Compare the commercial footprint of a product to its relevant peer set (inclusive of all U.S. physicians reached through personal promotion and field force activity):
- Total number of physicians
- Target specialties
- Market leaders
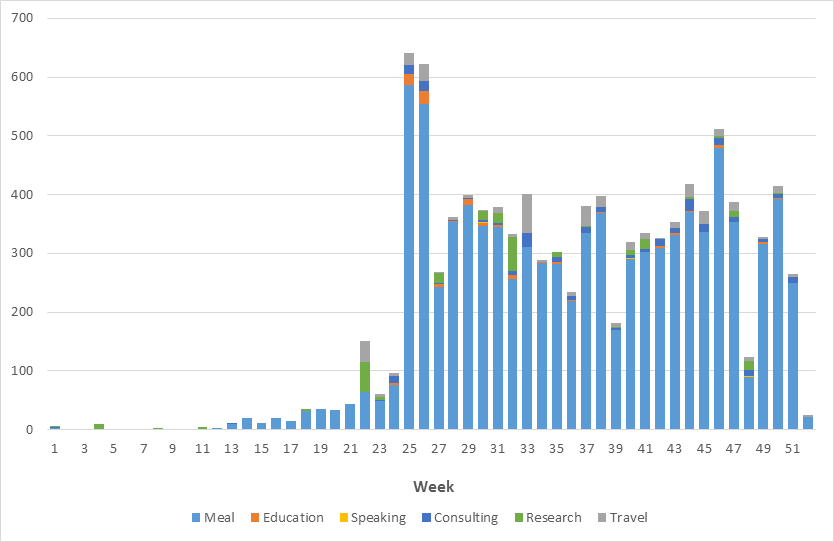
Longitudinal Trends
Gain insight into week-by-week activity for the product of interest (inclusive of meals, eduction, travel, speaking, and consulting):
- Interaction mix
- Interaction frequency
- Key event/launch sequencing
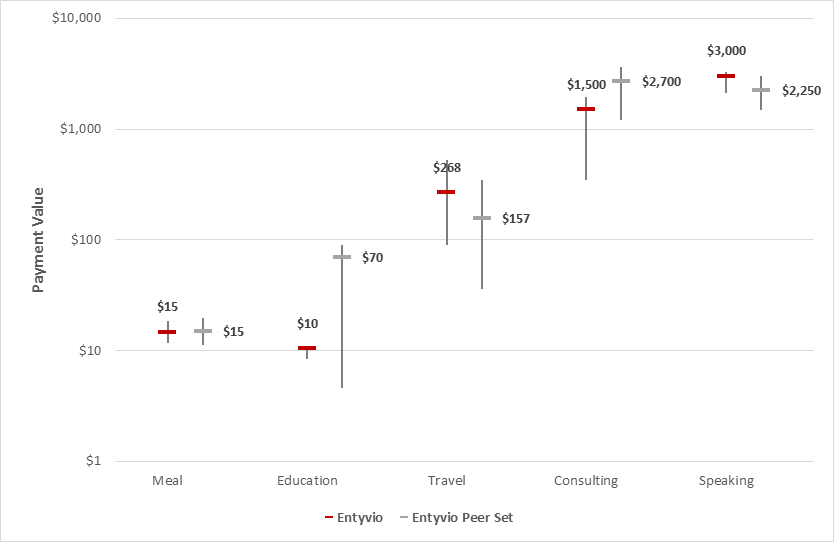
Spend and Fair Market Value
Quantify value of payments for the product of interest and compare to its peer set across the following metrics:
- 25th Percentile
- 50th Percentile
- 75th Percentile
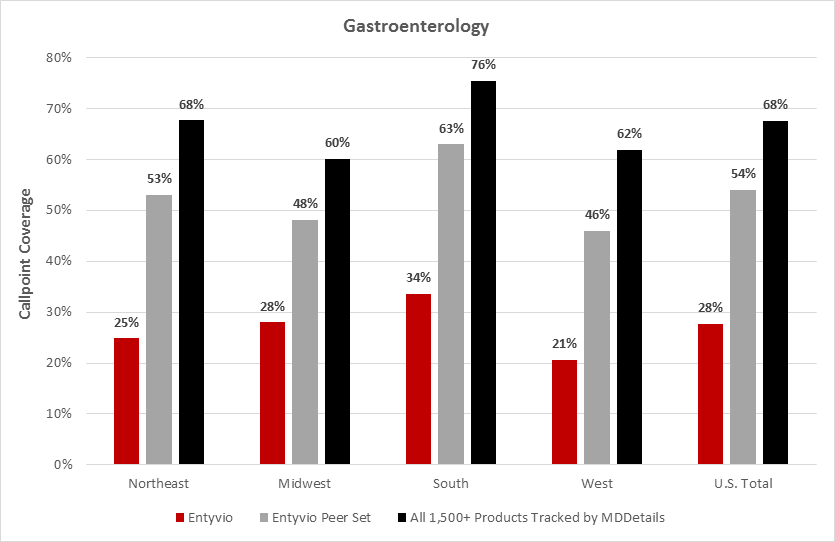
Prescriber Access Dynamics
Assess level of prescriber access for the product of interest and compare to its peer set as well as the overall market across the following dimensions:
- Physician Specialty
- Geography
- Time
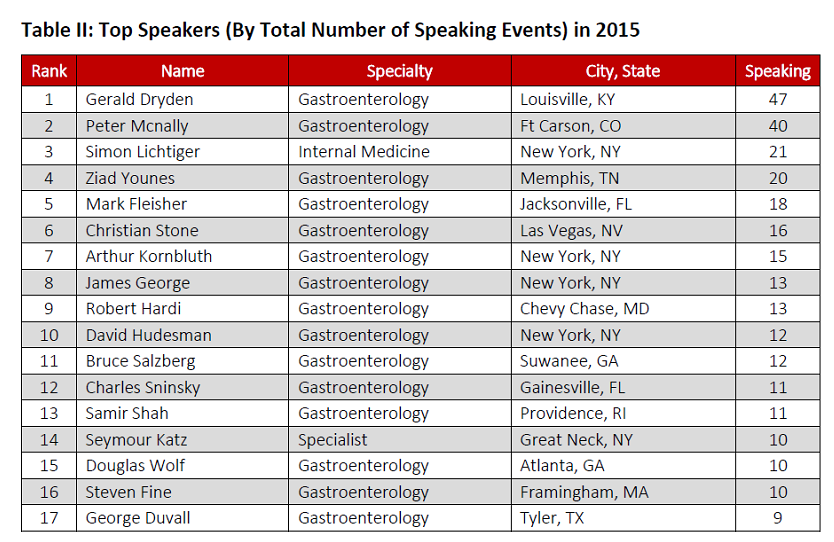
Key Individuals
Review ranked lists of product-specific opinion leaders (e.g., consultants and speakers) and target prescribers (up to 30 in each category):
- Name
- Specialty
- Location